Making sense of pensions and the day Jean Chatzky caused a Twitter uproar
I am by no means a social media expert; I often find it difficult to predict what output will capture attention and what won’t. Fortunately, I work with some really smart people who understand social media much better than I do.
But I don’t believe that even they could fail to be surprised by the contrast between the interest shown in two adjacent tweets issued by US financial journalist Jean Chatzky.
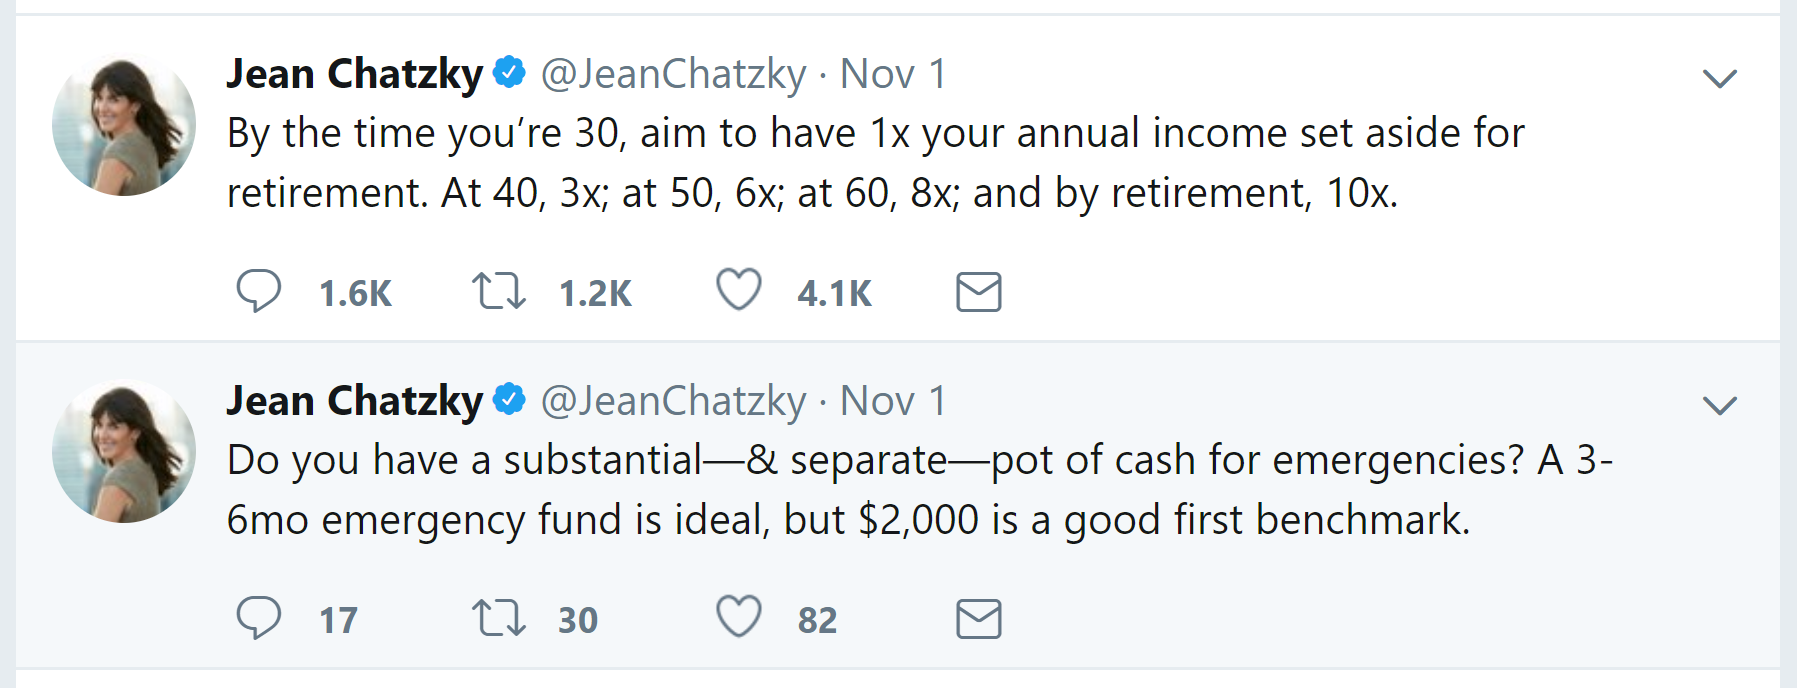
To be clear, I’d be delighted if I reach a position where one of my tweets achieves 17 comments, 30 retweets and 82 likes. But the intense interest in Chatzky’s subsequent post underlines just how powerful social media can be: 1,600 comments, 1,200 retweets, and 4,100 likes (and counting).
I read a selection of the comments and on balance these comments were critical and sometimes dismissive. To paraphrase, ‘how could anyone hope to achieve these salary multiples on top of all other living costs?’ was a common refrain. These comments were perhaps symptomatic of a wider, long-running issue around intergenerational wealth inequality.
Whilst no social media pioneer, I like to think I’m fairly handy with a spreadsheet. Combined with the good fortune of an employer who thought this would be interesting to look at more closely, I set about modelling the financial implications of Chatzky’s targets for UK residents earning average salaries.
As with all financial modelling, this required a bunch of assumptions. These are listed at the end of this blog post; all are designed to be realistic, but like all assumptions are nonetheless contestable.
UK tax and pensions
The principle of the UK government encouraging citizens to plan for retirement through a contributory pension is almost one hundred years old.
Individual tax relief on contributions was first introduced in the 1921 Finance Act. The intention of the tax incentive is to encourage citizens to defer cash whilst in work to fund a more comfortable retirement. This is part of a ‘life-cycle’ approach to financial planning, which recognises that individual demand for and supply of cash are not coterminous over the life course.
Tax relief on contributions is capped for all UK residents in two ways.
1. The first is a life limit, which is £1million for everyone. This is immaterial to someone who retires after 45 years of work on a median salary: 10x the final median salary (the final ‘Chatzky milestone’) would be significantly less than £1million.
2. The second is an annual limit that is £40,000 for all except additional-rate taxpayers, for whom it reduces on a graduated scale until it reaches £10,000. For a more detailed exposition of the UK pension framework, download our free Guide to Tax Efficient Investing.
The model demonstrated in this blog post recognises that tax relief will be available on pension contributions. Tax relief is available at the marginal rate of tax that would be paid on the pound.
Median earners did not enter the higher-rate income tax band at all between 1999/2000 and 2014/15 and are assumed to pay standard-rate income tax throughout the model.
Growth in investment value
Investments offer the potential to grow in value, as well as deliver income through dividend payments. The longer the time horizon over which these investments are held, the greater the opportunity to deliver growth.
Pensions are perhaps the longest-term investment any of us will make. Beginning to make pension contributions at an early stage of the working life is hugely advantageous in this respect, particularly if the value of the pension investments increases rapidly.
The model varies the rate of return delivered by pension investments to demonstrate just what a significant impact this can have.
Putting the model to the test
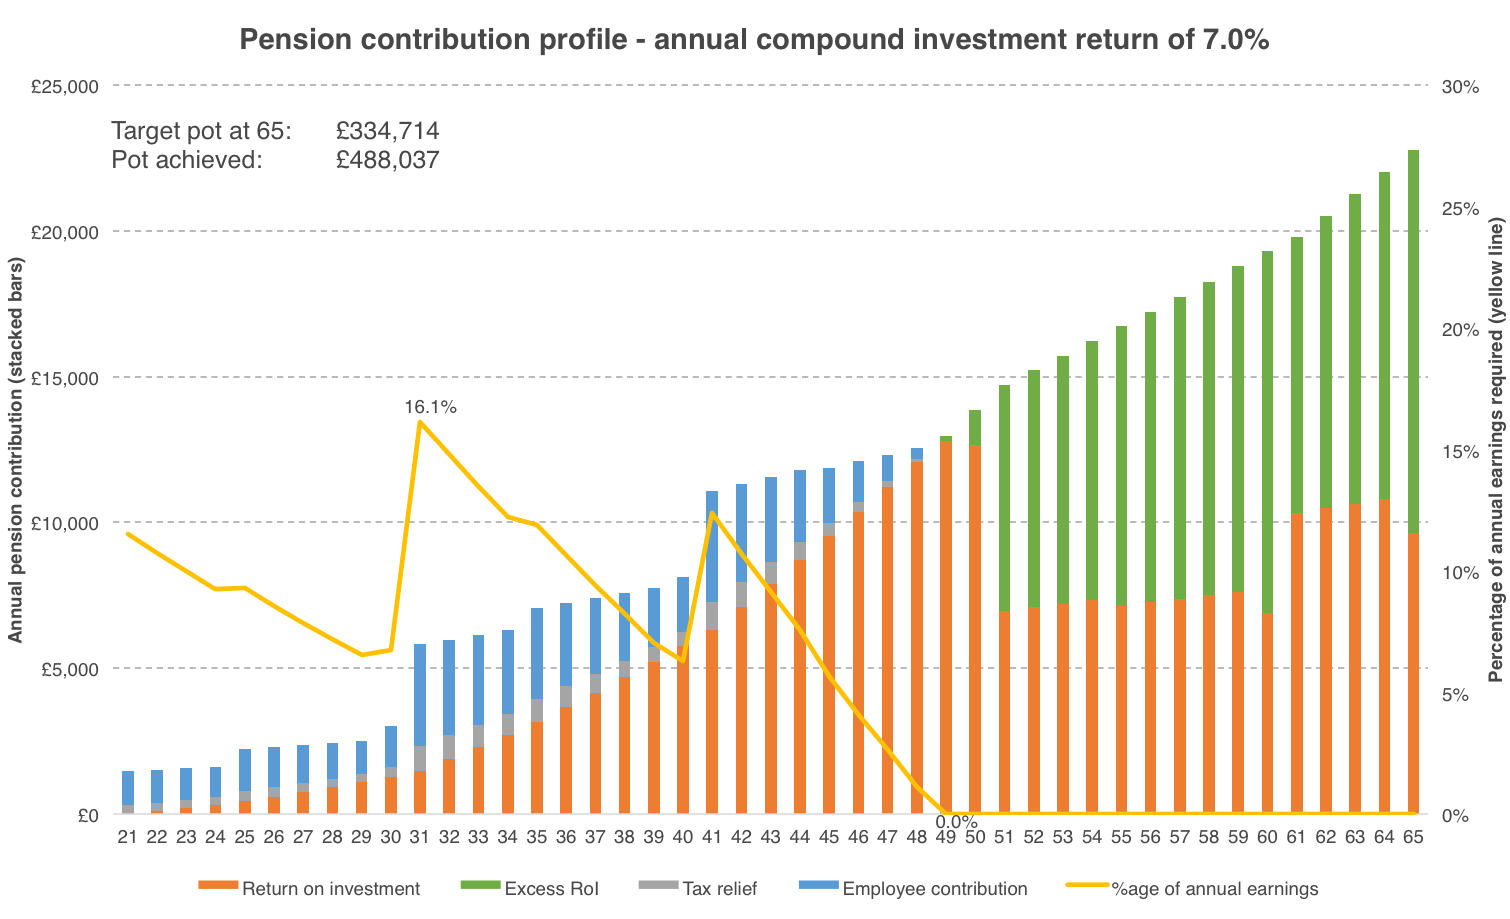
The figures below identify the contributions that are required to hit the ‘Chatzky milestones’. These should be interpreted as follows:
- The yellow line refers to the annual percentage of income that needs to be contributed to meet the next - and cumulatively every - milestone; this should be read against the right-hand y-axis. The highest and lowest annual percentages are highlighted on each chart.
- The stacked bars comprise the three separate sources of pension contribution: return on investment (orange), personal income (blue), and tax relief (grey). A fourth (green) bar signifies any return on investment that exceeds the required annual contribution. These correspond with the left-hand y-axis.
- Three scenarios have been developed. The only variable that has been altered is the annual growth in the value of the investment. The profile of contributions is identical across the three scenarios, but the source of the contributions varies noticeably.
- Scenario A assumes an annual growth of 1.0% over 45 years.
- Scenario B assumes an annual growth of 4.0% over 45 years.
- Scenario C assumes an annual growth of 7.0% over 45 years.
Although the notion that the rate of growth would be constant over 45 years is improbable, the rates of growth represent realistic averages.
Scenario A: Annual investment return of 1.0%
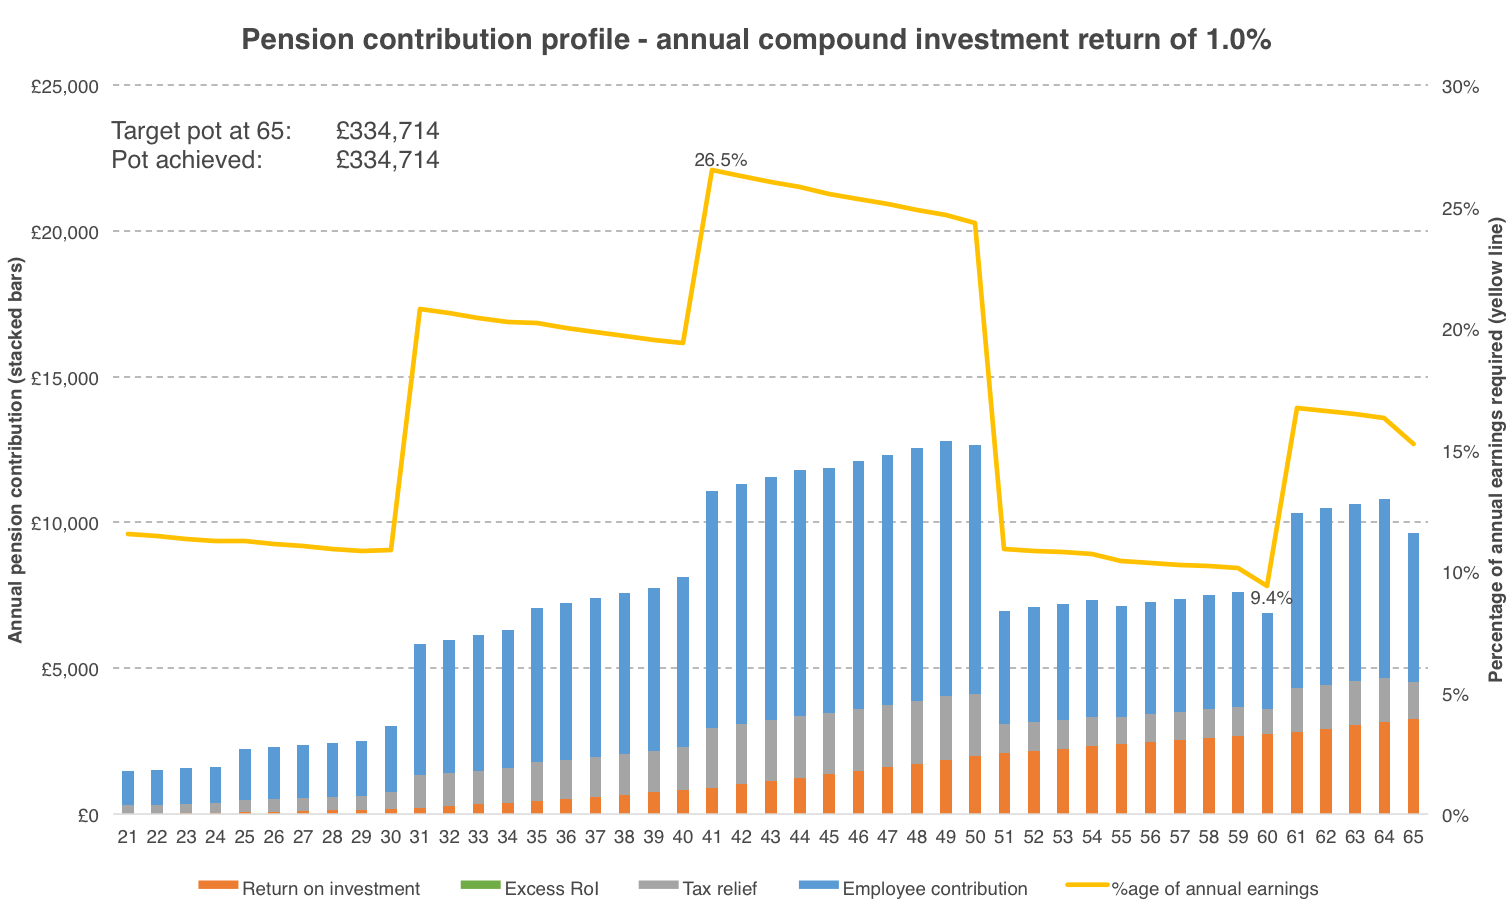
In scenario A, the value of the pension investments increases by just 1.0 per year.
Contributions as a percentage of annual earnings are maximal at 26.5% (aged 41) and minimal at 9.4% (aged 60). This contribution profile demonstrates that achieving the milestones is possible, even with a low rate of investment return.
However, achieving this would require financial discipline, particularly during when aged 31-40, when contributions hover around 25% of earnings.
Scenario B: Annual investment return of 4.0%
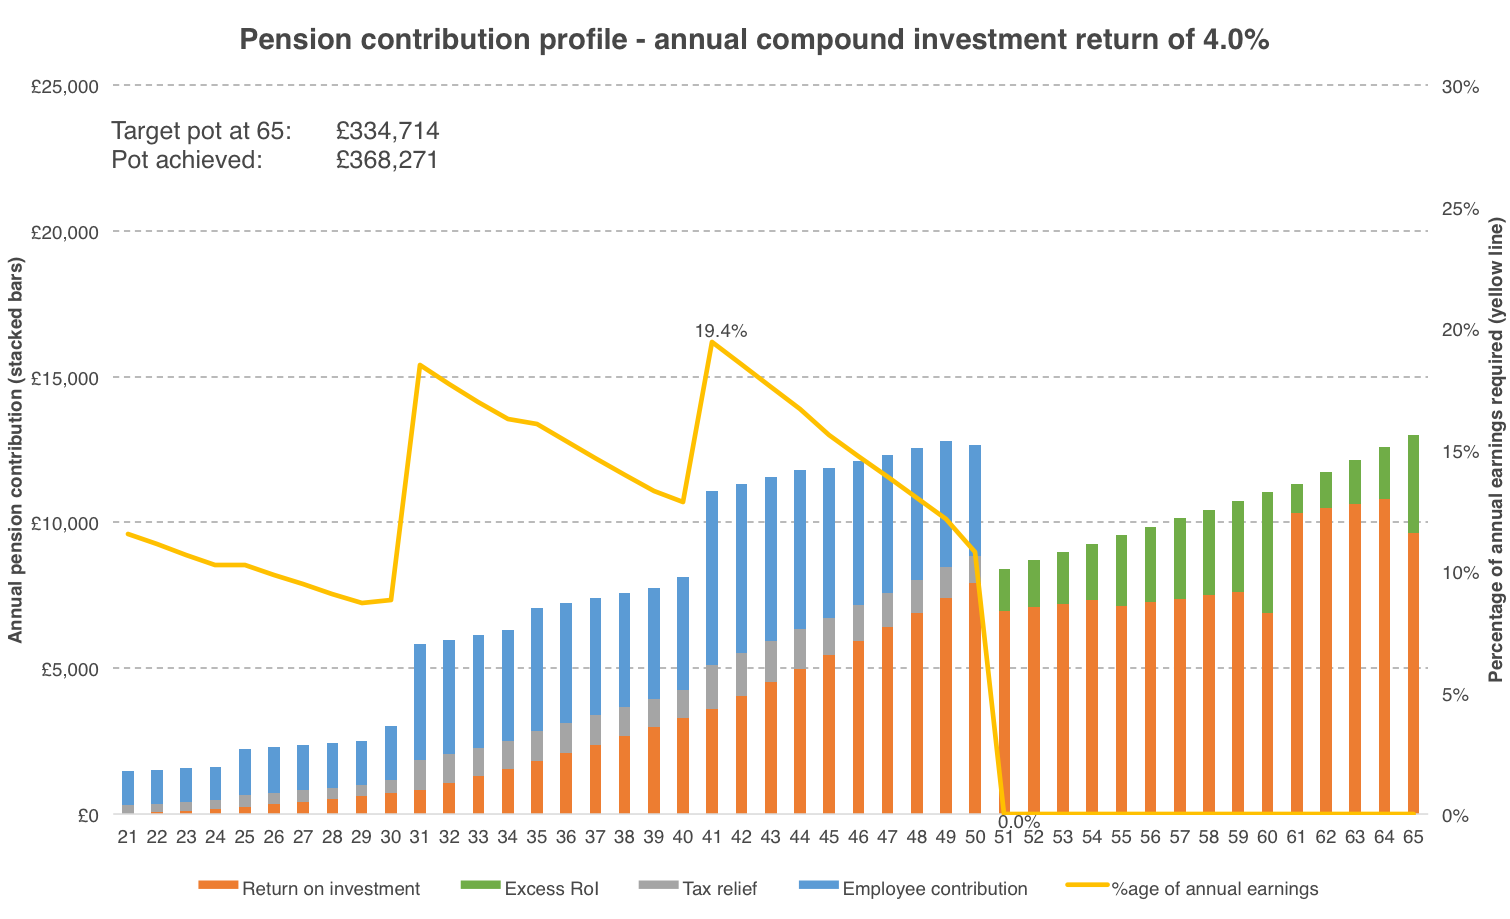
In scenario B, the value of the pension investments increases by 4.0 per year. Contributions as a percentage of annual earnings peak at 19.4% (aged 41) and – because of the higher return on investment – fall to zero from age 51.
Because the return on investment exceeds the requirement from this point, the final pension pot is worth £33,500 more than the model requires.
Scenario C: Annual investment return of 7.0%
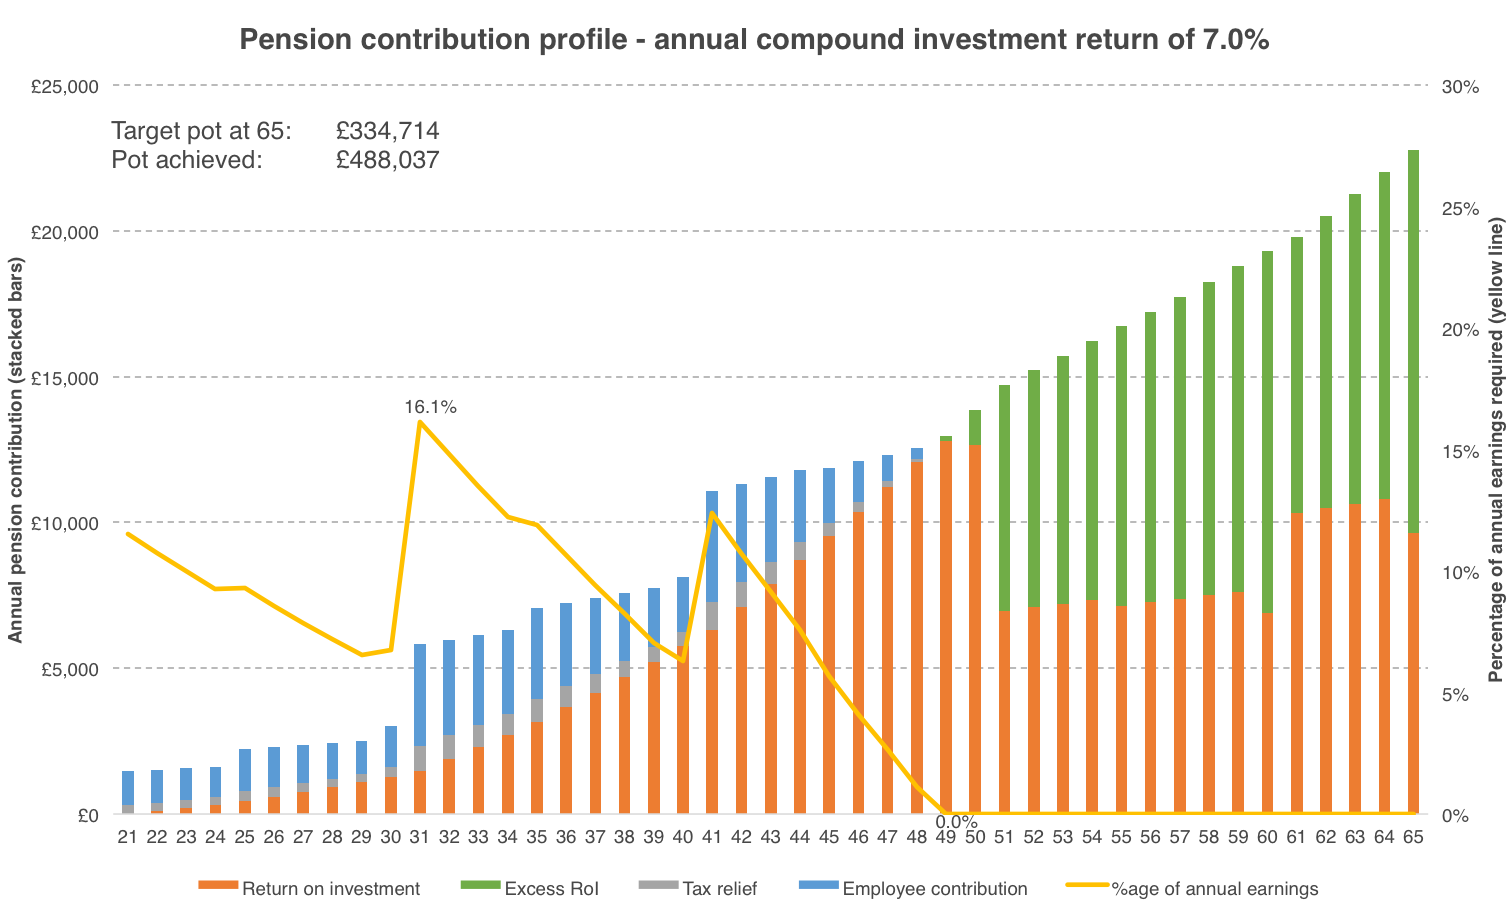
In scenario C, the value of the pension investments increases by a generous 7.0 per year.
Contributions as a percentage of annual earnings are maximal at 16.4% (aged 41) and – because of the higher return on investment – fall to zero from age 49.
Because the return on investment exceeds the requirement from this point, the final pension pot is worth fully £153,000 more than the model requires.
Are the ‘Chatzky milestones’ realistic?
The thresholds generated by the milestones determine that contributions as a proportion of income are higher at the start of a new life decade and gradually reduce over the subsequent nine years.
The reality for many people is that financial decisions are slightly more reactive and often based on disposable income, rather than earnings. Disposable income may not follow the same life-course profile as earnings.
If this favours greater disposable income in the younger years, this might enable people to exceed the milestone at 30 years of age, to reduce the contributions required at a later date; this enables them to benefit from growth in investment value.
If, however, they fall behind the early milestones, they may seek to retrieve this in later life. This may be possible if they have greater disposable income (e.g. once children become financially independent), but their smaller investment pot will benefit less from increases in investment value.
Moreover, whilst a pension remains a very good long-term investment product, it should not automatically take precedence over competing, more immediate demands upon cash.
For example, a parent may consider moving house to fall within the catchment area for a better school for their children. How would the outcomes that using their cash in this way compare against pension contributions? That’s tough to say with any authority, but it would be hasty to automatically advise against doing so purely to achieve the milestones.
The challenge presented by the ‘Chatzky milestones’ is also their virtue. Meeting the targets at the end of each ten-year period provides a requirement that enables the pension pot to benefit from growth in value over a long period. However, this also provides inflexibility that might make the targets difficult to adhere to.
Final thoughts
This is really all about personal financial planning. The fundamental principles of Chatzky’s original claim are that (a) planning for retirement is in each individual’s best interests; and (b) that the earlier in the working life this is addressed, the better.
The model demonstrates that this is broadly correct, but that the return on investment that pension contributions achieve can be hugely influential: the lower the return on investment, the more burdensome the contribution on current earnings, particularly for people striving to hit milestones at age 40 and age 50.
Two thoughts on which to close:
- Pensions are not unique in offering income tax relief. VCTs, EIS and SEIS all offer income tax relief on investments at rates that exceed the current standard rate of income tax. SEIS investments even offer income tax relief at a rate (50%) that exceeds the current additional rate of income tax. Although these investment schemes have qualification criteria, they nonetheless give the opportunity to access capital before retirement without incurring a direct penalty.
- Pensions are not homogenous; this post has focussed on the contributions that someone earning an average salary would be required to make to achieve the milestones originally set out by Jean Chatzky. If you’re a business owner, you may instead want to consider more hands-on pension products, such as Small Self Administered Schemes (SSASs). SSASs offer a range of benefits to you and your business; find out more about SSASs by watching our on-demand webinar with Terry Dunbar, CEO of SSASCo.
[Model assumptions]
- A 45-year working life. Some people will work for fewer years, some people will work for more, but this as good an estimate as any.
- That growth in absolute median earnings followed the trend observed in the UK between 1999/2000 and 2014/15. This trend has been extended to cover a 45-year working life.
- That the proportion of overall median earnings earned by different age groups (in five-year bands) in 2014/15 can be applied consistently through the model. Inevitably, some age groups exceed the overall median (e.g. 40-44, by 23%) and some fall below it (e.g. 20-24, by 29%).
- That people contribute to their next ‘Chatzky milestone’ proportionate to their salary. If their next ten-year target was £19,200 and they earned 8.6% of their period earnings in year one, they would contribute of £1,646.
%20(3)%20(2).jpg)
